« With New Rules for Gifted Programs, NYC's Poor and Minority Students Lose Out | Main | Cool People You Should Know: Brian Jacob »

At Some KIPP Schools, KIPPster-ettes Outnumber KIPPsters

| 5 Comments
smurfette.jpg
If you're not already enjoying Richard Whitmire's new gender blog, you could be. Yesterday he wrote that KIPP "is an important player in the boy troubles" because boys at KIPP start 5th grade behind the girls, but catch up to them by 7th grade.

This may very well be true, but there's another KIPP gender story that has received less attention: many KIPP schools have non-trivial gender imbalances and lose boys at a faster rate than they lose girls. Certainly I'm not the first to point this out, as the San Francisco Schools blog reported a year ago that African-American boys leave Bay Area KIPP schools at alarming rates , a finding that Ed Week followed up on in this article on KIPP attrition.

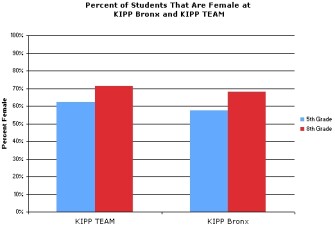
To check out the gender balance in New York area schools, I looked up the School Report Card data for KIPP Bronx and KIPP TEAM in Newark, the two KIPP schools in the area that were at full scale (i.e. they serve grades 5-8) when the last round of NY and NJ school report cards were released. From the disaggregated test score data, I pulled the number of girls and boys tested in grades 5 and 8. This is a decent proxy for the gender composition by grade, which is not available elsewhere - though it's certainly possible that more boys than girls sat these tests out.

In each of these schools, there were more girls than boys in the 5th grade classes. At KIPP TEAM/RISE in Newark (the two schools' 5th grade numbers are reported together because they're under the same charter), 62% of 5th graders were girls, as were 58% of students at KIPP Bronx. In the same year, the 8th grade composition was 71% female at KIPP TEAM and 68% female at KIPP Bronx. These data don't allow us to trace one cohort through school, but they do suggest that more girls are sticking with KIPP than boys. (KIPP's own report card from this school year also confirms that there's a gender imbalance in these schools; KIPP reports that 57% of students overall at KIPP Bronx are girls, 54% are girls at KIPP TEAM, and 57% are girls at KIPP RISE.)

kipp.jpg

The boys who stay at KIPP may, as Whitmire wrote, do extremely well. But it appears that at least in some cities, boys are also less likely to attend KIPP schools - and stay there.

Previous posts on KIPP are here:

* Do KIPP Schools Have a Positive Effect on Their Students' Achievement?
* When a Lottery Is Not a Lottery
* Does KIPP Provide a Solution to the Problems of Urban Education?
* What Lessons Does KIPP Offer for Urban School Reform?
* Comment on "Lies My KIPP Teacher Told Me"
5 Comments

I love my freshmen and sophomore males as much as my females. It is so frustrating, however, to see the way they rob the females of a chance to learn to the fullest.

I agree with Robert Pondiscio that much of the "Achievement Gap" is due to the "Time on Task" gap.

Education theorists are damaging males, as well as females, as we "define deviancy down" by allowing males enough rope to metaphorically hang themselves.

Being a teen has always been like walking a tight rope. We are afraid of damaging kids, especially males, if we don't loosen our behavioral standards. But when you loosen a tight rope, it becomes even tougher to keep your balance.

Males would love it if we demanded more of them.

Where do the boys go? Back to public school, right?

Dear eduwonkette,

I am the founder of TEAM Academy and the Executive Director of TEAM Schools, the network of KIPP schools in Newark, NJ. It is rare that I have time to respond to articles or blog entries, but I feel that this is an important topic and would like to set the record straight on the subject of gender imbalances in attrition at TEAM Schools. To put it simply, boys do NOT leave TEAM Schools at a higher rate than girls.

I appreciate your acknowledgement that your conclusion - that TEAM Academy loses more boys than girls - is weakened by your lack of access to cohort data. I'm writing today to supplement the data you do have with some that you wouldn't have been able to find on the state's website, in the hopes of painting a fuller and more accurate picture of our attrition patterns.

As you mentioned, we have multiple schools in Newark under one charter. TEAM Academy is 6 years old and serves grades 5-8, while Rise Academy is only 2 years old and serves grades 5-6. For the sake of accuracy I will use numbers that disaggregate the TEAM students from those at Rise, and since Rise will not serve 8th grade for two more years, I’ll leave them out of this analysis. If you're interested, overall attrition at Rise Academy has been under 4% for both years of their existence, and no gender patterns have emerged yet within this rather small sample.

The 5th and 8th grade enrollment data you used in your comparison were from last year's 8th graders at TEAM and 5th graders at both Rise and TEAM. There are two problems with using these data that lead to a flawed and invalid conclusion:

1. These data compare students in different classes at different schools. You compared 5th graders at Rise and TEAM with 8th graders at TEAM only.

2. You compared data of two completely different groups of kids – last year’s fifth graders and last year’s 8th graders. As such, you do not account for fluctuations in the number of students from each gender who enter the school through our lottery each year. In other words, sometimes we have more boys in the lottery, and sometimes we have more girls.

Though you do acknowledge that the impurity of these data sets are problematic, you somehow nonetheless use these flawed data to come to an equally faulty conclusion: "These data don't allow us to trace one cohort through school, but they do suggest that more girls are sticking with KIPP than boys." I’m afraid that you underestimate how much of an apples-to-oranges comparison this actually represents.

To illustrate this point, consider the following data, from our current 5th and 8th grade classes at TEAM Academy (the ones you described were last year’s 5th and 8th grade classes):

Current 5th grade class: 48% boys, 52% girls

Current 8th grade class: 53% boys, 47% girls

Were we only to look at these numbers in performing the same analysis you performed, we would conclude that TEAM Academy actually does a BETTER job of holding onto its boys than its girls. Of course, this conclusion suffers from the same weakness from which your opposite conclusion suffers: neither describes the actual attrition of a single group of students over time.

To determine if more boys than girls left the school, one would need to track the same group of students who enter the school at the beginning of 5th grade and leave after 8th grade. We performed this analysis for TEAM Academy, and found that the facts lead to a dramatically different conclusion than the one you put forth.

Let’s take a look at the attrition data from a single cohort over time. For simplicity's sake, I will refer to each cohort of students by the name we give them when they are in our schools, which is determined by the year most of them will go to college. The current class of 8th graders, then, is referred to as "2012", the 7th graders are "2013", and so on.

Tracking the class of 2012 from 5th grade to 8th grade, our data reveal that we started with 81 students, with a few more boys than girls (53% boys, 47% girls). Of those 81 students, 21 of them left over the four years, for a four-year attrition rate of about 26%, or an average annual attrition rate of about 6.5%. Of the 21 who left, 10 were girls and 11 were boys. Since the class of 2012 started with more boys than girls, this leaves us with attrition rates that are almost exactly equal between the two sexes.

Since the current class of 7th graders have been in our school for only three years, the data on their attrition are not as informative, but I'll mention them anyway in case you're interested. Our current 7th grade class, the class of 2013, has lost 12 students; 7 boys and 5 girls. These numbers are probably too small and too heavily impacted by random circumstance to be very meaningful (the majority of our students who leave do so because they are moving out of state), but we will certainly keep our eyes on 2013's attrition patterns to try to make sure this trend doesn't expand over the next few years.

So from the data we have, TEAM Academy does not in fact seem to be losing boys at a faster rate than we are losing girls. Though we'll continue to monitor the relative retention of our boys and girls, we don't currently see a gender imbalance.

Your article also mentions the overall gender imbalance of a couple of our classes. The ones you mention in particular are two of the most imbalanced classes we've ever had. Our overall numbers are as follows: 55% girls, 45% boys. Frankly, we don't know why some classes have more boys and some have more girls, and we also don't know why overall we have more girls than boys. As I've shown above, it's not that we're losing more boys than girls, but rather that more girls are signing up for our lottery. Since our lottery is blind, the only way we could equalize the numbers is through gender-targeted recruitment, which is fairly difficult but worth considering. We are currently trying to get to the root of our lottery pool's imbalance in order to determine how to address it.

Again, thank you for drawing attention to this important topic. It is critical that all schools seek to serve all of their students equally well, and your vigilance on behalf of boys is appreciated. I appreciate this opportunity to set the record straight. If you would like to learn more about our schools, I would be happy to have you come out to Newark and visit at any time.

Thank you,

Ryan Hill

Executive Director

TEAM Schools, a network of KIPP schools

Percents really shouldn't be used when n

Their 8th grade went from 43 boys and 38 girls down to 32 boys and 28 girls.

Mr. Hill didn't give enough information to talk about their 7th grade.

Given the small size of each grade, I think aggregating across grades and schools would be useful - were the data available.

But another question: do they typically lose a quarter of their students between grades 5 and 8?

Ryan, Thanks for adding data on the subsequent classes. Because it seems unlikely that the lottery for the class displayed above was 71% female, I wonder if there is a school longevity effect here, such that the expectations of the school aren't fully understood by lottery entrants in the early years, so perhaps there is more attrition among some groups than others when schools are new. But as the school grows, kids/families who select into the lottery have a better idea of what they're getting in to, which reduces the attrition problem.

Regarding the gender composition of the lottery entrants, a quick look at the NCES Common Core of Data for NJ charter schools suggests that you are not alone - at least for 03-04, the year that I had handy, there are slightly more girls than boys in NJ charters overall. I'll try to do more work with these data and let you know what I find.

Jonathan, Losses of about 25% are not atypical at KIPP schools, though it's impossible to tell how much of that loss is just residential moves and how much is kids deciding they'd rather go to school elsewhere. See this previous post:

http://eduwonkette2.blogspot.com/2007/10/does-kipp-provide-solution-to-problems.html

Comments are now closed for this post.
Advertisement

Archives

Recent Comments

  • eduwonkette: Ryan, Thanks for adding data on the subsequent classes. Because read more
  • Jonathan: Percents really shouldn't be used when n Their 8th grade read more
  • Ryan Hill: Dear eduwonkette, I am the founder of TEAM Academy and read more
  • Jonathan: Where do the boys go? Back to public school, right? read more
  • john thompson: I love my freshmen and sophomore males as much as read more

Most Viewed
On Education Week