Easel.ly, a website for designing graphics, demonstrates in a series on its blog how educators can use infographics in aligning reading and literature instruction to the Common Core State Standards. Each week the site will spotlight one of the English/language arts common standards.
The posts, like this one from February 6, offer example graphics and ideas for applying common standards to reading, broken down by grade level, including kindergarten through 2nd grade, 3rd through 5th grade, 6th through 8th grade, and 9th through 12th grade.
Educators can use the site, and others like it, to create lesson plans, worksheets, presentations, and other visuals. Infographics can be shared on social media, projected onto a whiteboard, or printed out as individual worksheets. Easel.ly and other sites offer ready-made themes or designs to simplify the creation process.
Easel.ly suggests creating graphics that address thematic units and can showcase students’ understanding of books or passages. Ninth grade students can compare Abraham Lincoln’s first and second inaugural addresses and display their findings through an infographic they create. Or, as shown in the example graphic below, 3rd grade students can analyze the Bill of Rights by choosing three amendments they think are the most important and summarizing them.
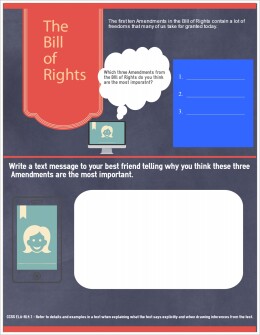
Graphic courtesy of easel.ly
Here are a few infographic creation websites:
- Easel.ly uses a theme-based drag-and-drop interface. It offers 15 themes or the option to upload a background image. Add images to an infographic from categories like animals, icons, and people. Easel.ly is still in beta version, so it’s free.
- Piktochart also uses a drag-and-drop interface. Several themes are available. Share the graphics on social networks or download high-quality files. Many big-name companies use this infographic creator, like GE and Red Bull. There’s a free version, but Piktochart also offers several paid options, from $14 to $29 a month. Educators can use the free version with seven themes.
- infogr.am makes it simple to create more than 30 types of charts using its spreadsheet editor. Import XLS or CSV files and create visualizations or charts. Download infographics in PNG or PDF format, or publish them online to share or embed them on websites. Info.gram offers free and $18 a month options.
- visual.ly is a similar website to create and share infographics. But visual.ly also acts as a marketplace for connecting graphic designers with people who need them. It also has cloud-based collaboration tools.
- gliffy is a tool to make flowcharts, diagrams, and other chart-based visuals. It can be used as a plug-in to Confluence, a collaboration platform. There are free and paid options.
What are other tools do you use to design visuals for your class? Share your ideas for merging infographics and the common standards in the comments or on Twitter @EdWeekTeacher.
Have fun creating!