
This year will go down in history as a milestone year for the teaching profession.
In six states, tens of thousands of teachers walked out of their classrooms to protest low salaries and cuts to school funding. Nearly 180 current classroom teachers ran for their state legislatures on a platform centered around funding education, and 43 of those teachers were elected. Suddenly, the whole country seemed to be talking about how underpaid and overworked teachers are.
No wonder some deemed 2018 as the “year of the teacher.”

And these implications will stretch far beyond the new year. Take a look at some of the most significant research findings related to teachers that were published in 2018.
Chart #1: More Than Half of Teachers Are Not Satisfied With Their Salaries
Fifty-five percent of teachers said they are not satisfied with their teaching salary, according to data from the 2015-16 National Teacher and Principal Survey, a nationally representative survey conducted by the U.S. Department of Education.
The national average public school teacher salary for 2016-17 was $59,660, according to data from the National Education Association. (The NEA estimated that the average salary for the 2017-18 school year is $60,483.) But this varies widely between states.
And teachers who are not satisfied with their paychecks are more likely to say their enthusiasm is waning, they’d consider leaving the profession for a higher-paying job, and the stress and disappointments of teaching “aren’t really worth it.”
Chart #2: Teachers Say Salary Is Key to Recruitment and Retention
The Education Week Research Center conducted a nationally representative survey of more than 500 K-12 teachers, and asked what districts should do differently to find and hire high-quality teachers. The No. 1 answer was to improve pay and benefits, followed by offering more professional autonomy, greater respect, and better working conditions.
But when asked what keeps teachers in their current jobs, 18 percent said leadership is a key factor, while 17 percent cited salary considerations. (For more ideas on getting and keeping good teachers, check out Education Week’s special report.)
Chart #3: The Public Thinks Teachers Should Be Paid More, Too
After the spate of widescale teacher walkouts that protested low wages, the public is more in favor of raising teacher pay. A nationally representative survey from the journal Education Next found that nearly half of those provided with information on average teacher salaries in their state said the pay should increase. That’s 13 percent higher than last year, and the largest change in opinion that EdNext saw on any single policy from last year.
Chart #4: Parents Don’t Want Their Children to Become Teachers
A growing number of parents of school-aged children said they have trust and confidence in public school teachers. But just over half of parents said they would not want their child to become a teacher, according to the PDK International poll on education.
“I feel like there’s a narrative that has been created about public schools in our country that is not helpful,” said Joshua Starr, the CEO of PDK International. “We can’t have it both ways. You can’t say, ‘Yeah, education is great, but I don’t want my kid to become a teacher.’ ... It’s problematic for our country.”
Chart #5: Teachers’ Pension Debt Is a Growing National Crisis
Teachers’ pension debt today tops out nationally at more than $516 billion, and some states project they won’t have enough money within the next decade to pay teachers what they’re owed at retirement.
But pension reform is a politically volatile issue: Just look at Kentucky, where a reform bill sparked teacher walkouts and protests (and was struck down by the state’s high court in December). Stay tuned to see how—or if—states tackle their pension crises in 2019.
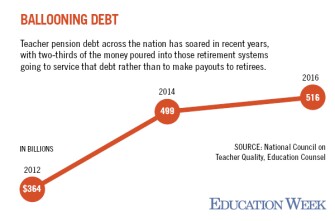
Chart #6: Record Waves of Teachers Ran for Office This Year
Scores of teachers ran for political office this year, with many fired up because of the walkouts. Education Week counted nearly 180 current K-12 teachers who ran for their state legislatures.
Out of the 120 teachers who were on the ballot in November, just 43 teachers were elected. It was a mixed bag of results for educators.
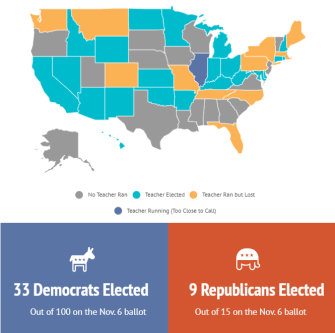
(Since this chart was made, one more teacher—a Democrat in Illinois—was elected in a closely contested race. The total count is now 43 teachers who have won state seats.)
Chart #7: More Teachers Could Drop Out of Their Unions After Supreme Court Blow
In June, the U.S. Supreme Court ruled to prohibit public-sector unions from collecting “agency” or “fair share” fees from nonmembers. The decision is expected to lead to an exodus of members from the teachers’ unions since people can now be represented in collective bargaining without having to pay anything.
Anti-union groups are already targeting teachers to get them to drop their memberships. The National Education Association is projecting steady membership declines, along with a $50 million budget reduction over two years.
Chart #8: Most Teachers Do Not Want to Be Armed
After the school shooting in Parkland, Fla., in which 17 people were killed, President Donald Trump suggested arming about 20 percent of the nation’s teachers. He also suggested that educators who agree to carry should get bonuses.
It was a controversial debate that was widely unpopular among teachers. (It’s worth noting that this isn’t purely hypothetical: In certain places, teachers who have received training are allowed to carry guns at school.)
Chart #9: Teachers Are Not Sold on High-Stakes Evaluations
In June, an evaluation of the Bill & Melinda Gates Foundation’s multi-million-dollar teacher-evaluation reform found that the project largely fell short of its goal to increase student achievement.
“This suggests that focusing on [teacher effectiveness] alone is not likely to be the potent sort of intervention that really moves the needle on student outcomes,” said Brian Stetcher, the lead author of the report.
Chart #10: Teachers Are Not Immune to Sexual Harassment and Assault in the Workplace
A quarter of female educators said they have been sexually harassed or assaulted at work, according to a nationally representative survey conducted by the Education Week Research Center.
Even though the education field is dominated by women, teachers told Education Week stories of permissive school cultures where abusers are not punished and about the threat of power differentials between novice teachers and their superiors.
“What has struck me most in my reporting, and what I found the most heartbreaking, was how desperately some teachers we spoke with wanted to share their stories because they wanted to make their workplaces safer and their professions better,” reporter Arianna Prothero wrote. “But they weren’t convinced that their small stand would ultimately make a difference. And in weighing that against the risk to their livelihoods, they decided to remain silent. I can’t tell you their names or their stories. All I can tell you is that they exist, and they are surviving.”

For past years of research, see:
